Economic and Fiscal Impacts of Proposition 45
Table of Contents
- I. Executive Summary
- II. Prop 45 Overview
- III. Residential Impacts
- IV. Non-Residential Impacts
- V. Conclusion
- VI. Technical Appendix
Acknowledgements
This report was prepared by James Paci and Matthew Newman of the Blue Sky Consulting Group for the California Chamber of Commerce. The analysis presented and the conclusions of this report are those of the authors.
I. Executive Summary
Proposition 45 Overview
Proposition 45 (the “Building an Affordable California Act”) would reform state laws governing the review and approval of certain construction projects in California, including new homes, educational, public health, and public safety facilities, and expansions of transportation, clean energy, and broadband infrastructure (i.e., “essential projects”). This report provides estimates of the economic and fiscal impacts that Prop 45 would generate in California.
Under current law, the approval timeline for essential projects can last several years, resulting in higher construction costs and reduced investment in housing and infrastructure. Prop 45 would reduce review period delays by establishing binding time limits on these review phases and by introducing further procedural reforms related to environmental review litigation, late-filed public comments, and the analysis of project alternatives. Reducing these delays under Prop 45 would result in more housing, lower construction costs, and significant savings for taxpayers and ratepayers.
Prop 45’s Estimated Impacts on Housing, Taxpayers and Ratepayers
- Nearly 20,000 additional homes annually. Prop 45’s approval timeline reductions will increase annual housing permitting by 18.1%, or nearly 20,000 additional homes per year, resulting in nearly 200,000 additional homes over ten years.
- $774 million in total annual savings on non-residential construction costs. Across both publicly and privately sponsored essential non-residential projects, Prop 45 is estimated to reduce costs by $774 million annually.
-
Approximately $1.5 billion annually in combined savings and additional revenues for state and local governments and other public agencies. Over the 10-year period following Prop 45’s implementation, the measure’s residential and non-residential impacts are estimated to generate $1.5 billion annually, on average, in additional tax revenues and fiscal savings, including:
- $1.1 billion in state and local tax revenues from increased residential construction, and
- $386 million in annual savings for public works project sponsors, including $238 million in transportation projects, $73 million in water projects and $52 million in educational facilities.
- $250 million in annual savings for California ratepayers. Prop 45’s impact on clean energy project costs is estimated to save California ratepayers $250 million annually.
Prop 45’s Estimated Impact on CEQA Review Timelines
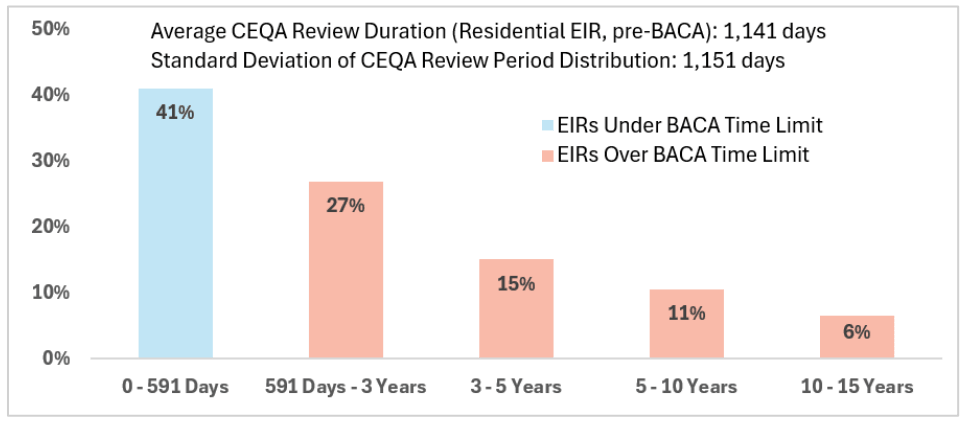
- Under current law, EIR reviews take approximately three years. Prop 45’s time limits would reduce delays related to project reviews under the California Environmental Quality Act (CEQA). For residential projects requiring an Environmental Impact Report (EIR), as shown in Figure 1, the CEQA review period lasts 1,141 days (3.1 years), on average, under current law; non-residential EIR review periods average 1,101 days (3.0 years).
- Most EIR reviews exceed Prop 45’s time limit. Under current law, 59% of residential EIRs and 56% of non-residential EIRs take longer than the 591-day maximum review period established by Prop 45.
- Prop 45 would cut the average EIR timeline in half. Due to the enforcement of Prop 45’s 591-day limit on EIR certifications, the average EIR review period would decline by 639 days for residential EIRs and 603 days for non-residential EIRs.
- Prop 45 would make EIR timelines more predictable. Under current law, roughly 17% of EIR reviews last longer than five years (see Figure 1). By capping this period at 591 days, Prop 45 reduces this review period uncertainty. Among the residential EIRs exceeding this time limit, the average review period was 1,674 days (4.6 years); under Prop 45, these projects’ average review period would decline by 1,082 days or roughly three years.
- Non-EIR project reviews would also be completed more quickly. Projects receiving Mitigated Negative Declarations (MNDs), Negative Declarations (NDs) or CEQA exemptions currently have estimated average review periods of six to eight months. Depending on review type, Prop 45 is estimated to reduce these timelines by one to two months.
Figure 1. Distribution of Status Quo Residential EIR Certification Timelines (2020 – 2026)
- Other Prop 45 reforms would further reduce review period delays. In addition to its CEQA review period limits, Prop 45 also establishes time limits for other phases of project review, including 30 days for application completeness, 135 days for other discretionary approvals following CEQA review, and 300 days for judicial review. The measure also includes procedural reforms related to streamlined analysis of project alternatives, late-filed public comments, and judicial review. The economic and fiscal estimates in this report quantify only the impacts of Prop 45’s CEQA review timelines and therefore represent conservative lower-bound estimates. They do not include potential impacts from these additional timeline and procedural reforms.
Impact of Prop 45 Timelines on Residential Construction Activity
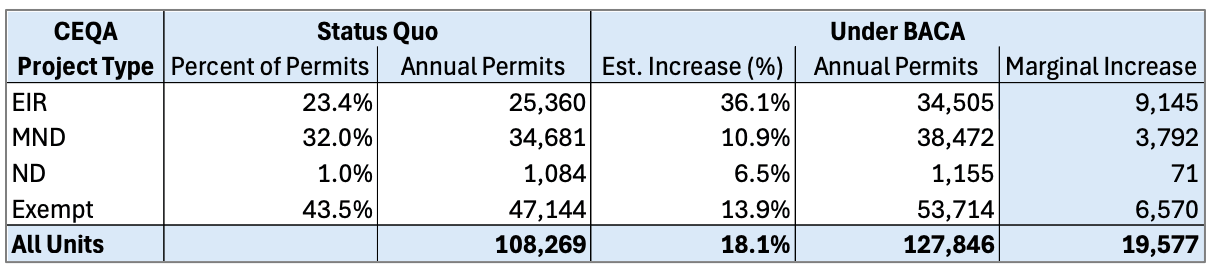
- Residential permitting would increase by 18.1% under Prop 45. As shown in Figure 2, based on Prop 45’s estimated impact on CEQA review timelines, the measure would increase annual permitting rates by an estimated 18.1%, or nearly 20,000 additional homes annually. The largest increase occurs among EIR projects, which account for 23.4% of units permitted under the status quo; EIR housing starts are estimated to increase 36.1%. Increases among the non-EIR project types range from 6.5% to 13.9%.
Figure 2. Estimated Increase in Units Permitted Annually by CEQA Project Type
- Prop 45’s impact on the statewide housing supply is estimated to reduce housing costs by 0.66% after ten years. Over the 10-year period following Prop 45’s implementation, given the estimated increase in annual permitting, the measure would increase California’s housing stock by nearly 200,000 units, or 1.21%. This additional supply is estimated to reduce housing costs by 0.66% relative to status quo trends.
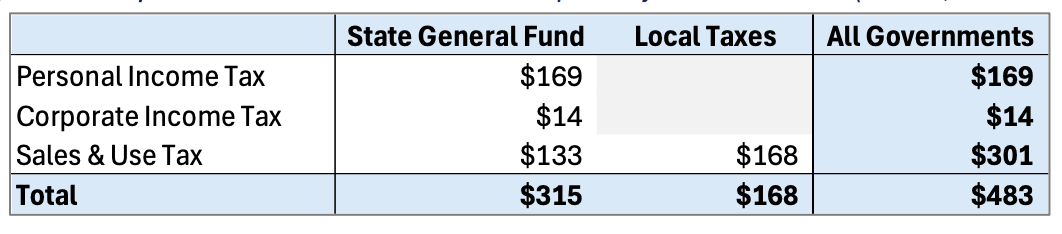
- Over a ten-year period, the construction of new homes under Prop 45 would generate $1.1 billion of tax revenue annually for state and local governments. As shown in Figure 3, the increase in homebuilding would produce an estimated $315 million annually for the State General Fund and $168 million annually for local governments in construction period tax revenues (i.e., personal income taxes, corporation taxes, and sales taxes). Additionally, on average, these new units would generate $618 million in property tax revenue annually for local governments over the first ten years following Prop 45’s implementation (increasing from $112 million in Year 1 to $1.12 billion in Year 10).
Figure 3. Average Annual Tax Revenues from Residential Construction Over 10-Year Period (mil 2025 $)

Impacts of Prop 45 Timelines on Non-Residential Construction Costs
- By reducing delay, Prop 45 is estimated to reduce non-residential EIR project costs by 3%, on average. Due to construction cost inflation and the cost of pre-development stage capital, review period delays increase public agency construction costs by 1.34% to 1.95% per year of delay (depending on the essential project category) and private sector costs by 1.70% to 4.95% per year. Under Prop 45, the estimated 1.65-year reduction in average EIR timelines would therefore generate per-project cost reductions of 2.22% to 3.22% for public agencies and 2.81% to 8.17% for investor-owned utilities (IOUs) and other private sector sponsors. On average, across all EIR projects, costs would decline by an estimated 3.0% under Prop 45. The measure would also reduce costs on non-EIR projects.
- Non-residential cost reductions under Prop 45 would generate annual savings of $774 million. An estimated $49.4 billion is spent annually on essential non-residential projects in California. As shown in Figure 4, given Prop 45’s estimated impacts on EIR and non-EIR project costs, the measure would generate an estimated $774 million in annual construction cost savings, including $386 million for public agencies, $250 million in clean-energy project savings accruing to California ratepayers, and $137 million for other private essential-project sponsors.
Figure 4. Estimated Annual Non-Residential Project Savings by Sponsor Type and CEQA Project Type (2025 $)

II. Prop 45 Overview
Prop 45’s provisions fall into two broad categories: binding time limits controlling the duration essential project review periods (“timeline provisions”), and procedural reforms that provide options for simplifying a project’s environmental review and any related litigation (“procedural reforms”).1
Application receipt to application completeness (30+ Days)
Within 30 calendar days of the submission of an essential project application, Prop 45 requires the public agency to determine whether the application is complete. Applicants have 90 days to amend and resubmit applications that are determined incomplete.
Application completeness to CEQA Determination (90 – 591 Days)
Once an application is deemed complete, any environmental review conducted by a lead agency under CEQA is subject to a CEQA review time limit that varies according to the type of CEQA review conducted. Prop 45 requires that EIR certification decisions be made within 365 business days (531 calendar days) of application completeness.2 For projects receiving a mitigated negative declaration (MND) or Negative Declaration (ND), this determination must be made within 180 business days (262 calendar days) of application completeness. Notices of a project’s exemption from CEQA are required within 90 business days (131 calendar days).
If the lead agency fails to comply with the applicable CEQA review time limit, the applicant may request a public hearing. Within 60 calendar days of this request, the lead agency must complete its CEQA review and issue its determination. As a result, under Prop 45, the maximum timeline for an EIR certification, for example, would generally be 591 days (i.e., 531 days for the certification of an EIR plus this 60-day noncompliance period), while the maximum timeline for an Exempt project is 191 days.
Other Entitlement (135 days)
In addition to CEQA review, essential projects may also require other discretionary approvals. Under Prop 45, the public agencies responsible for these other entitlements must provide approvals within 90 calendar days of the completion of CEQA review. Because agencies that fail to meet this deadline must act within 45 days of an essential project applicant’s written request, Prop 45 effectively limits this review period to 135 days.
Litigation (300 days)
Prop 45 requires that legal challenges brought against essential projects be filed within 30 days of a lead agency’s CEQA determination and that courts resolve this litigation within 270 days using judicial streamlining procedures available for certain projects under existing state law. A summary of Prop 45’s time limits for each phase of essential project review is shown in Figure 5.
Figure 5. Summary of Prop 45 Time Limits by Phase of Essential Project Review (Calendar Days)

Note: Figure shows calendar days.
*High end of range includes the 60-day noncompliance period for CEQA review determinations and 45-day period for other entitlements.
III. Residential Impacts
Project carrying costs, including interest on loans, land holding costs, consultant and legal fees, and construction cost inflation, accrue throughout the entitlement process, and incremental increases in these costs reduce project feasibility, causing projects to be delayed, downsized, or abandoned. Timeline uncertainty compounds this effect, as lenders and investors are more likely to advance projects when entitlement durations are predictable. The expected review timeline reductions under Prop 45 would therefore increase the number of financially feasible projects and raise rates of residential development.3
Entitlement Time and Entitlement Volatility Elasticity
Prior studies of residential project review periods and development feasibility in California show that development activity is responsive to changes in both the average duration of the entitlement review period as well as changes in the uncertainty (or “volatility”) of this timeline.
Entitlement Time Elasticity
The entitlement time elasticity refers to the extent to which a reduction in the average duration of a project’s entitlement review generates an increase in the rate of homebuilding. Two prior studies in California have estimated this elasticity. First, a Terner Center analysis of housing project feasibility assessed the impacts of various reforms of local zoning rules and entitlement procedures on the number of residential units developed in Los Angeles County.4 Terner’s findings are based on model pro formas that were developed for each residential parcel in Los Angeles County based on the parcel’s location, status quo zoning designation, and empirical estimates of the costs incurred by developers during each phase of entitlement, permitting, and construction. The Terner analysis finds that a 25% reduction in entitlement timelines would be expected to increase annual housing starts by 9.8% (i.e., an entitlement period elasticity estimate of 0.392).5 Consistent with the Terner Center’s finding, Gabriel and Kung’s (2024) analysis of City of Los Angeles entitlement and permitting data over the 2010-2022 period showed that a 25% reduction in average multifamily project approval time increased the number of residential units permitted annually by 11.4% (i.e., an approval time elasticity of 0.46).6
For purposes of estimating Prop 45’s impact on residential EIR project development, this report conservatively adopts the Terner Center’s entitlement time elasticity of 0.39.
Entitlement Volatility Elasticity
In addition to the average entitlement duration, entitlement time uncertainty is itself a significant factor affecting residential project feasibility, as investors and developers require larger returns to compensate for added project risks. Gabriel and Kung quantify this uncertainty based on the standard deviation of the natural log of multifamily project approval times and refer to this measure as approval time “volatility.”7 Based on multifamily development data in Los Angeles, the authors find that a decline of 25% in this log-form standard deviation increases residential project starts by 8.5% (i.e., a volatility elasticity of 0.327).
Prop 45 is Estimated to Cut the Average Residential EIR Project’s Entitlement Period in Half
Prop 45’s impact on average residential project review timelines and timeline volatility is estimated based on a comparison of estimated project entitlement times under current law (i.e., the “status quo” duration) and the maximum time limits allowed by Prop 45.8 Since entitlement timelines under the status quo and Prop 45’s reforms vary across CEQA project types, the measure’s impact on entitlement timelines is estimated separately for each CEQA type.9
Residential EIRs: Timeline Impacts and Housing Starts
For each CEQA project type, the status quo entitlement time is estimated as the sum of two sub-phases: the CEQA Review period and the Other Entitlement period. This section presents the average entitlement time and (where measurable) the entitlement time volatility of each sub-phase for each CEQA project type.
EIR Projects: Status Quo CEQA Review Durations
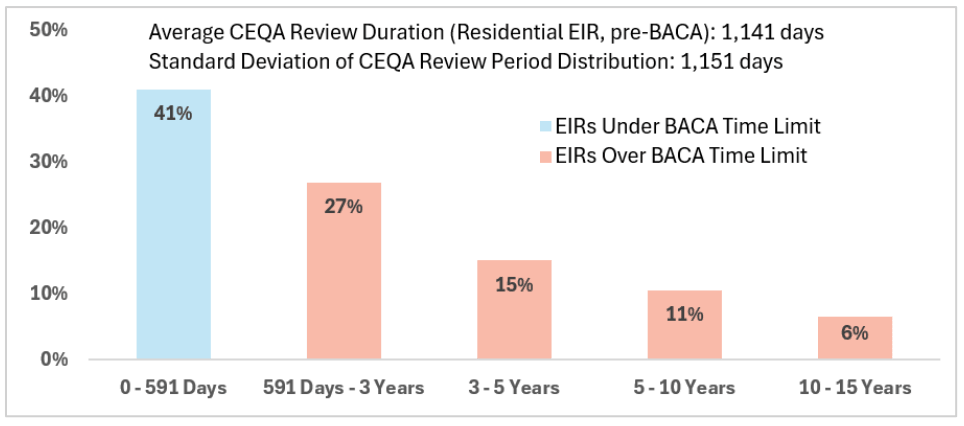
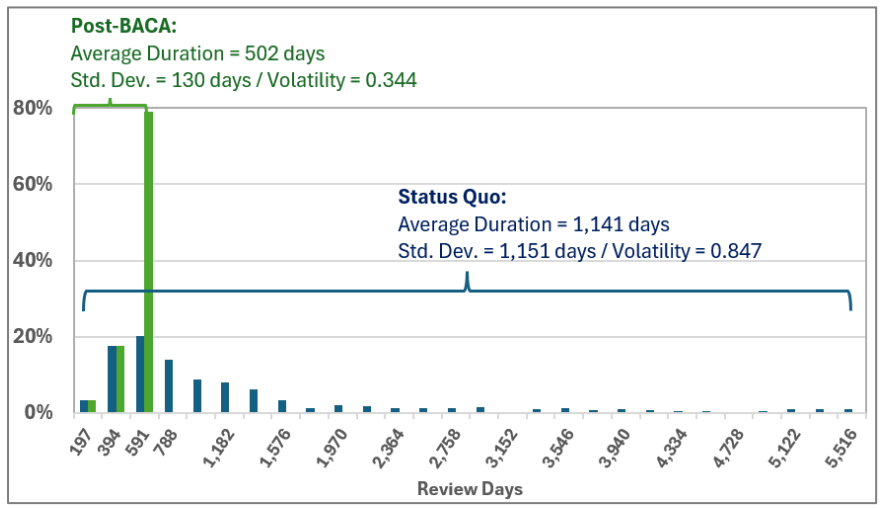
The status quo CEQA Review period duration for EIRs is estimated based on analysis of CEQA document timelines across a sample of 539 residential EIR projects that submitted data to the state’s CEQANet portal after January 1, 2020 (the “EIR Project Sample”).10 Figure 6 shows the distribution of CEQA Review durations across the 539 residential EIR projects included in the analysis sample. While the median CEQA Review duration was 715 days (or just under two years), the average NOP-NOD period was 1,141 days (or roughly three years). Forty-one percent of projects were certified within the maximum 591-day period allowed under Prop 45.11 Twenty-seven percent of the sampled projects’ review periods lasted between 591 days and three years. Nearly one in six residential EIR reviews in the sample took more than five years to complete, including 6% that took more than a decade.
Figure 6. Distribution of CEQA Review Durations for the EIR Project Sample (January 2020 – March 2026)
Prop 45 Would Cut Roughly Three Years from the Longest Residential EIR Timelines
Estimating Prop 45’s impact on the average residential EIR entitlement timeline requires calculating the difference between (a) the status quo average entitlement duration for the EIR project sample and (b) the average period across these projects if Prop 45’s 591-day CEQA review time limit were enforced against EIR projects with review durations exceeding this maximum. Similarly, Prop 45’s impact on entitlement volatility depends on the change in the standard deviation of project entitlement periods under the 591-day limit.
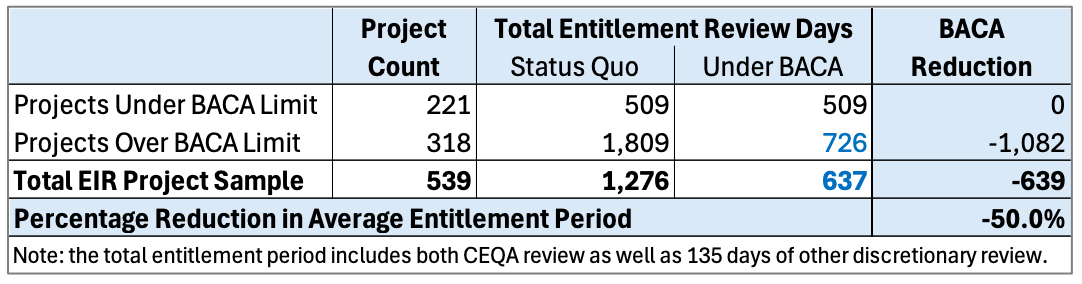
Figure 7 summarizes the calculation of the change in the average entitlement duration under Prop 45. Under the status quo, the average entitlement period is an estimated 1,276 days (i.e., 1,141 days of CEQA review plus 135 days of other entitlement review). Of the 539 projects in the EIR sample, 221 had their EIRs certified in fewer than 591 days, and the average total entitlement period for this cohort (509 days) is assumed to remain the same under Prop 45. For the remaining 318 projects with CEQA reviews exceeding the Prop 45 time limit, the average status quo entitlement period is 1,809 days, of which 1,674 days is CEQA review. Prop 45’s 591-day limit would reduce the total entitlement period to 726 days, on average (as it would reduce the CEQA review phase from 1,674 days to Prop 45’s 591-day limit). As a result, Prop 45 would cut the average entitlement timeline across all residential EIR projects roughly in half, from 1,276 days to 637 days. For projects exceeding Prop 45’s time limit, the reduction would be even greater: 1,082 days, or roughly three years.
Figure 7. Reduction in Average CEQA Review Period for Residential EIRs Under Prop 45
In addition to shortening average review times, Prop 45 would make EIR timelines substantially more predictable. As shown in Figure 8, Prop 45’s 591-day time limit would reduce the entitlement volatility (i.e., the log-form standard deviation of the timeline distribution) by roughly 0.5 (from 0.847 under the status quo to 0.344 under Prop 45).12
Figure 8. Change in EIR CEQA Review Period Distribution Under Prop 45
Prop 45 Would Increase Annual EIR Unit Permitting by 36%
To estimate Prop 45’s impact on the rate of EIR project permitting, the entitlement time and entitlement volatility elasticities are applied to the reductions in the mean timeline and timeline volatility. As shown in Figure 9, given the estimated entitlement time elasticity of 0.392, the 50% reduction in the mean entitlement duration generates a 19.6% increase in production (i.e., 50% × 0.392). Additionally, the decline in entitlement volatility (i.e., 0.503) is multiplied by the estimated volatility elasticity (0.327) to generate a 16.4% increase in housing starts. In total, these two impacts generate an estimated 36.1% increase in EIR project housing starts.
Figure 9. Estimated Percentage Increase in EIR Housing Starts

Residential Non-EIRs: Timeline Impacts and Housing Starts
Non-EIR Projects: Status Quo CEQA Review Durations
MND, ND, and Exempt projects’ estimated average durations are based on a survey of California cities issued by the Association of Environmental Professionals (AEP).13 According to this study, on average, CEQA reviews lasted six months for NDs and Exempt projects, and eight months for MND projects.
Non-EIR Projects: Reduction in Average Entitlement Time and Entitlement Volatility
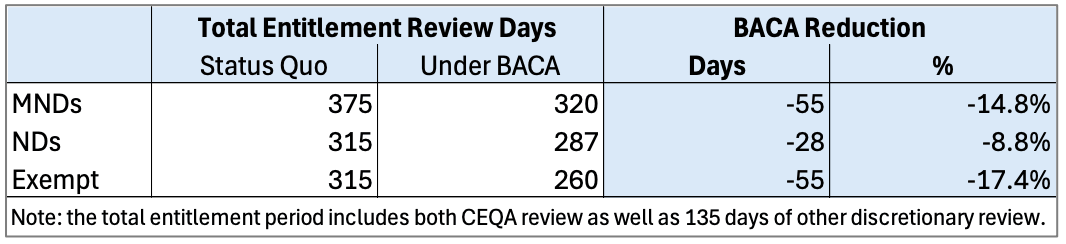
Prop 45’s impact on non-EIR entitlement timelines and volatility was estimated based on applying Prop 45’s time limits (i.e., 322 days for MNDs and NDs; 191 days for Exempt) to modeled distributions of MND, ND, and Exempt project CEQA review timelines.14 Figure 10 shows the results of this analysis. Under Prop 45, the average CEQA review period would decrease by 55 days for MND and Exempt projects and by 28 days for ND projects, representing a decline of 8.8% to 17.4% in the non-EIR entitlement period.15
Figure 10. Reduction in Non-EIR CEQA Review Periods Under Prop 45, by Non-EIR Project Type
Estimated Percentage Increase in Non-EIR Housing Starts
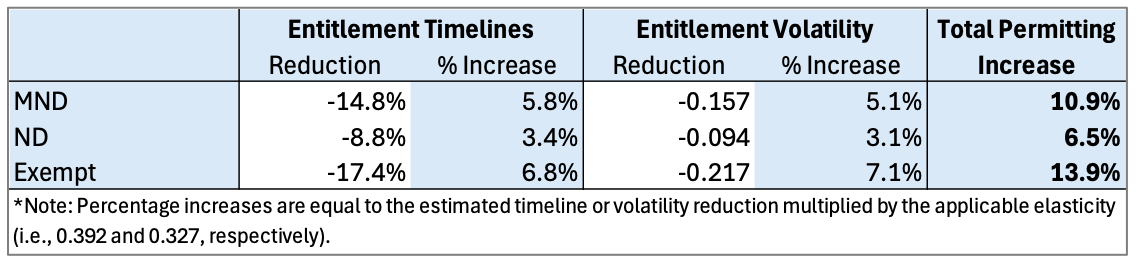
Given the compression in CEQA review periods and the resulting reduction in the volatility of each non-EIR project type’s review period distribution, Prop 45 would additionally reduce the non-EIR entitlement volatility coefficient, as shown in Figure 11.16
Applying the respective timeline and volatility elasticities to the percentage reduction in each measure for non-EIR projects under Prop 45 generates estimates of the increase in units permitted for each non-EIR type. MND project housing starts are estimated to increase 10.9%; ND and Exempt project development is estimated to increase by 6.5% and 13.9%, respectively.
Figure 11. Estimated Percentage Increase in Non-EIR Housing Starts
Prop 45 Would Add Nearly 20,000 Housing Units Annually
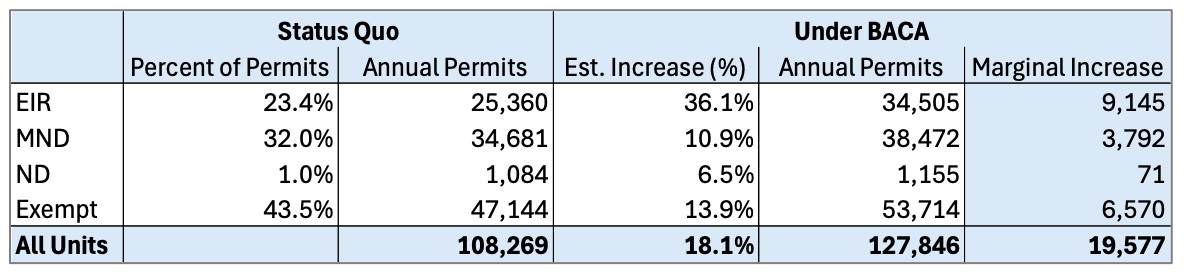
To estimate the absolute increase in annual permitting under Prop 45, the estimated percentage increases for each CEQA type were applied to estimates of annual units permitted for that type under the status quo.17 Figure 12 shows the results of this analysis. Prop 45 is estimated to generate a 9,145-unit increase in annual EIR permitting. Across all CEQA project types, annual permitting is estimated to increase by 19,577 units.
Figure 12. Increase in Housing Starts Under Prop 45
Economic and Fiscal Impacts of Increased Residential Construction
Prop 45’s Impact on Housing Affordability
By adding nearly 200,000 homes over ten years, Prop 45 would increase housing supply and put downward pressure on rents and home prices. Based on the state Department of Finance (DOF) estimates of the total statewide housing stock (15.06 million units as of 2026) and status quo permitting rates (i.e., 108,269 units annually), the increase in residential construction under Prop 45 would increase the state’s housing stock by 1.21% after 10 years.18 According to a recent Pew Research Center analysis, a 10% increase in a metropolitan region’s rental supply resulted in a 5.4% reduction in the region’s rents relative to nationwide rent cost trends (i.e., a “supply-price effect” of 0.54).19 Based on this effect, Prop 45’s supply impact would reduce average rents and home prices by 0.66% (i.e., 1.21% × 0.54).
Macroeconomic Benefits of New Housing
In addition to Prop 45’s expected impact on housing costs in California, new housing also generates spillover economic and fiscal benefits that exceed the housing affordability impacts shown above. Empirical studies of supply-constrained housing markets have shown that unlocking new housing supply in high-cost regions promotes economic growth by enabling more workers to access the higher-paying jobs concentrated in these areas.20 This expansion of the regional labor supply, in turn, attracts more firms to the area. Housing construction in high-demand regions additionally provides several quality-of-life benefits, including reduced commute times and household overcrowding.21
Fiscal Impacts of Increased Residential Development
Increases in residential development generate additional tax revenues for state and local governments on a one-time basis during the construction period and on an ongoing annual basis once the new units are complete. Construction period tax revenues include personal income taxes (PIT) generated by income earned by construction workers and firm owners, corporation taxes generated by the corporate profits from this activity, and sales taxes on construction materials and equipment. Ongoing property tax revenues are generated annually once a new unit is added to the local property tax roll.
Construction of Nearly 20,000 Additional Homes Each Year Represents an Estimated $11.2 Billion in Annual Residential Construction Output
The increase in construction period-related state and local tax revenues under Prop 45 depends on the overall increase in residential construction spending. Given estimated per-unit development costs (i.e., $573,800) and the estimated increase in annual permitting (i.e., 19,577 units), Prop 45 would result in an $11.23 billion increase in annual construction output, as shown in Figure 13.22
Figure 13. Estimated Increase in Residential Development Spending Due to Prop 45 (Annual, 2025 $)

Increased Construction Under Prop 45 Would Generate $483 Million of Tax Revenue Annually
The estimated increase in the PIT, corporation tax, and sales tax due to Prop 45 is based on the increase in residential project spending attributable to the new units developed (i.e., $11.23 billion, as shown in Figure 13); the percentage of this total that is attributable to labor income, corporate profits, and purchases of taxable construction materials; and the average state or local tax rate applicable to each of these three tax bases.23
As shown in Figure 14, the estimated $11.23 billion increase in annual residential construction spending would generate an additional $169 million in personal income taxes paid by construction firm workers and proprietors. Corporate profits from this activity are estimated to generate an additional $14 million and spending on the purchase of taxable construction materials accounts for an additional $133 million for the state General Fund. In total, the state would collect an estimated $315 million annually from this activity. Additionally, the increase in taxable sales would generate $168 million annually for local governments.
Figure 14. Prop 45’s Construction Period Fiscal Impacts by Revenue Source (Annual, mil 2025 $)
Prop 45 Would Increase Annual Property Tax Revenues by $618 Million, on Average, Over 10 Years
Because Prop 45 would spur additional residential development, the measure would generate an increase in residential assessed value subject to the property tax.24 The additional assessed residential value developed under Prop 45 would increase each year as additional units are added to local rolls.25 As shown in Figure 15, Prop 45 would generate $112 million of property tax revenues for local governments in the first year post-implementation. By Year 10, the annual property tax revenues generated by the measure increase to $1.12 billion.26 Therefore, on average over this 10-year period, Prop 45 would generate approximately $618 million annually in additional property taxes.
Figure 15. Prop 45’s Property Tax Impacts (Annual Increase, 2025 $)

Summary of Fiscal Impacts from Residential Construction
Figure 16 summarizes these construction period and property tax impacts. Given a constant rate of residential unit permitting (19,577 units annually), the measure would generate an estimated $315 million of tax revenue for the state’s General Fund in each year. Local governments would additionally collect an estimated $786 million annually, on average (i.e., $168 million of sales tax revenue and $618 million of property tax revenue). Combined, the additional housing construction generated under Prop 45 is estimated to produce $1.1 billion annually in state and local tax revenues, on average, over the first ten years following implementation.
Figure 16. Revenues Generated by Prop 45 Development Over 10 Years (mil 2025 $)

IV. Non-Residential Impacts
By shortening non-residential project review timelines, Prop 45 would lower costs incurred by public agencies and California utility ratepayers or consumers. Longer project review periods increase total project costs through two primary channels. First, because the costs of pre-development activities, including planning, engineering, design, and environmental review, are incurred before construction begins, longer review periods impose higher carrying costs on sponsors (i.e., the “pre-development cost of capital”). Second, because construction costs have historically outpaced general inflation in California, delaying the start of construction imposes higher real construction costs on project developers (i.e., “construction cost inflation”).
Pre-Development Cost Impact
Project sponsors require a minimum annual rate of return on pre-development capital investments. The impact of these capital costs on total project budgets depends on the project sponsor type as well as the share of project expenses incurred during the pre-development period.
Public Agency and Private Sector Pre-Development Costs of Capital
For private sponsors, the cost of capital reflects the annual internal rate of return (IRR) required by a project’s investors or lenders. Because of the high risk of project failure during the planning and approval process,27 higher rates of return are demanded on pre-development stage capital than capital invested in shovel-ready projects. Because clean energy projects account for roughly 63% of total IOU and private sector essential project expenditures, and 100% of the annual essential construction spending incurred by California’s ratepayers, this report relies on market study estimates of the IRR typically earned on pre-development utility-scale solar project investments.28 Based on this research, the real private sponsor cost of capital is an estimated 16%.29
Though public agencies may not require or earn investment returns on their infrastructure spending, these entities may incur financing costs to the extent bonds are issued to fund these initial capital investments. In either case, given the time value of money, governments discount projects’ future benefits or costs when conducting benefit-cost analyses (i.e., for every year that a project or program’s benefits are delayed, their expected values are reduced by the chosen discount rate).30 Given the large share of public spending on transportation projects, this report adopts a discount rate of 4% as the effective public agency cost of capital.31
Impact of Pre-Development Capital Costs Across Essential Project Categories
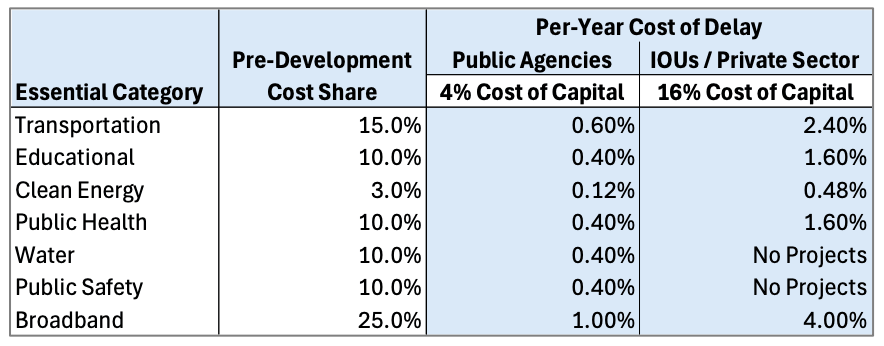
The per-year pre-development cost for each essential project category and project sponsor type is calculated by applying the discount rate or IRR (an annual percentage) to the percentage share of project expenses committed during pre-development (i.e., the pre-development cost share).
As shown in Figure 17, based on federal survey data and research materials, this cost share is estimated to range from 3% (for clean energy projects) to 25% (for broadband).32 As a result, a one-year reduction in the average transportation project review period, for example, is estimated to reduce total project costs by 0.6% if the sponsor is a public agency (i.e., 15% × 4%) and by 2.4% if the sponsor is a private firm (i.e., 15% × 16%).
Figure 17. Per-Year Cost of Capital Reductions by Essential Category and Sponsor Type
Impact of Construction Cost Inflation on Real Project Costs
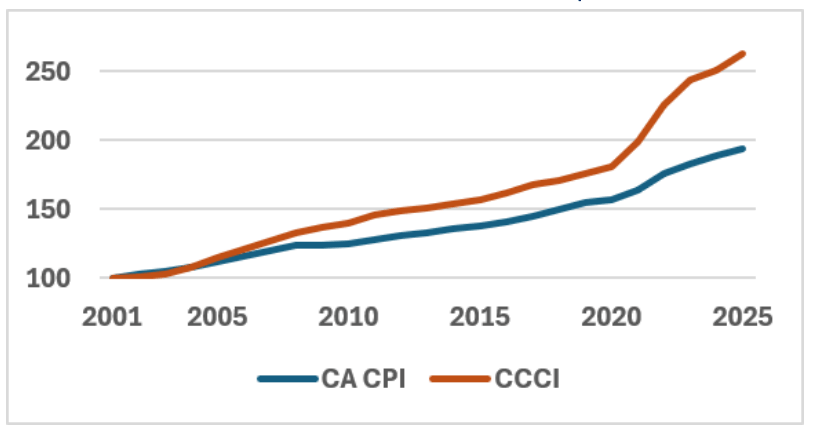
Rapidly increasing construction costs are one of the primary reasons review period delays may increase costs in real terms.33 According to the state Department of General Services’ (DGS) California Construction Cost Index (CCCI), nominal construction costs in California (i.e., construction materials and labor) increased by 67% over the 2015 – 2025 period, nearly 25 percentage points more than overall inflation in California (i.e., California CPI).34 In real terms, therefore, construction costs increased by roughly 18% (or 1.7% annually) during this period.35 Nationwide construction cost tracking data shows that since 1930, growth in the U.S. Consumer Price Index (CPI) has never outpaced growth in construction costs over the course of a full decade.36 Though historical cost trends may not guarantee that real construction costs will continue to grow in the years ahead, there are reasons to expect that the higher rate of CCCI inflation will persist.37
For this analysis, the annual cost of delay attributable to construction cost inflation is estimated based on the historical spread between CCCI growth and California CPI inflation over the 2001–2025 period, as shown in Figure 18.38 Over this 24-year period, the real rate of increase in the CCCI averaged 1.26% annually.39
Figure 18. California Construction Cost Inflation vs. Overall Inflation (2001 – 2025, Indexed to 2001)
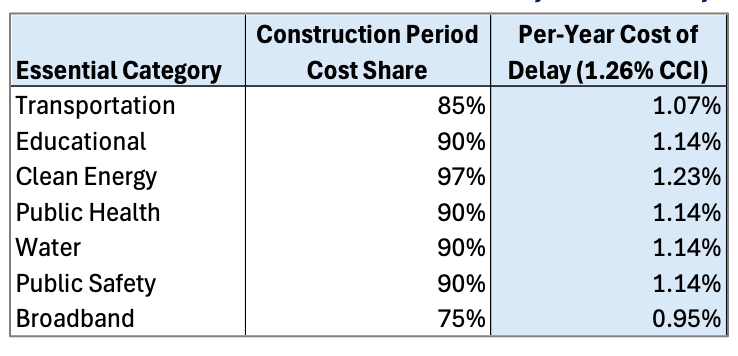
The per-year cost impact attributable to construction cost inflation is determined by multiplying the percent of a project’s budget spent during the construction period (i.e., the “construction period cost share”) by the annual rate of real construction cost inflation (i.e., 1.26%). For each essential category, construction period cost shares are equal to the budget remainder after excluding the pre-development cost share (estimated in Figure 17). Given these estimated shares, as shown in Figure 19, CCI increases project costs between 0.95% and 1.23% for each year of delay.
Figure 19. Per-Year Cost of Construction Cost Inflation by Essential Project Category
Total Annual Cost of Delay by Essential Project Category and Sponsor Type
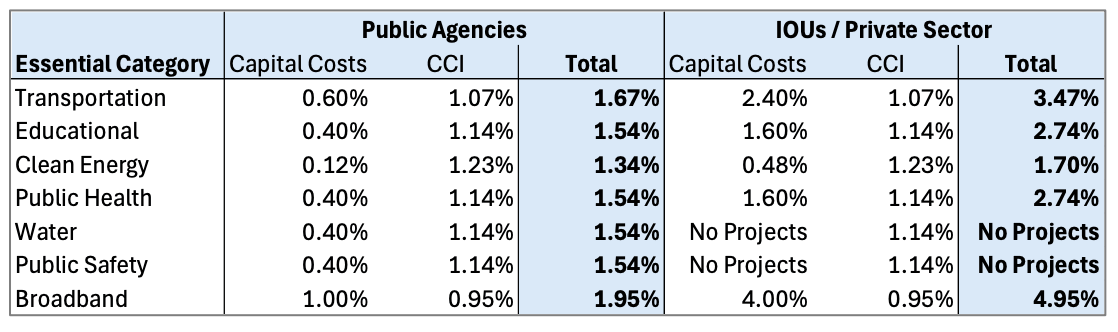
Based on the estimated per-year impacts for the cost of capital and CCI, Figure 20 shows total per-year project cost increases for each essential project category and each sponsor type. For public agencies, each year of delay imposes a cost of 1.34% to 1.95%, depending on the essential project type. For IOUs and private sector developers, total per-year delay costs are between 1.70% and 4.95%.
Figure 20. Total Per Year Cost of Project Delay by Essential Project Category and Sponsor Type
CEQA Review Period Reduction Under Prop 45
Given estimates of the per-year cost of delay for non-residential projects, the savings generated under Prop 45 depend on the review period reductions (in years) that would result from the measure.
Non-Residential EIR Timeline Impact
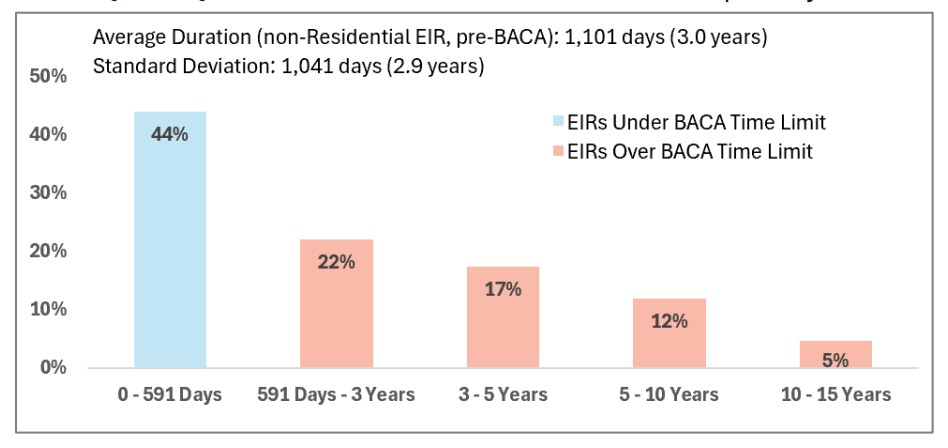
As with the analysis of CEQA review periods for residential EIRs, estimated non-residential EIR timelines are based on a sample of non-residential EIRs certified over the 2020 – 2026 period. Figure 21 shows the distribution of CEQA review durations across a sample of non-residential EIR projects.40 On average, these projects’ CEQA review periods lasted 1,101 days (or 3.0 years). Forty-four percent of projects were certified within the maximum 591-day period allowed under Prop 45, with more than half of projects (56%) requiring more than 591 days. Five percent of sample projects were certified 10 or more years after the beginning of their CEQA review.
Figure 21. Status Quo CEQA Review Durations for Non-Residential EIRs (January 2020 – March 2026)
The average reduction in CEQA timelines under Prop 45 is shown in Figure 22. Of the 327 EIR sample projects, 144 had their EIRs certified in fewer than 591 days; it is assumed that Prop 45 would not reduce timelines for these projects. For the remaining 183 projects with review periods exceeding Prop 45’s time limit, the status quo duration was 1,668 days. Therefore, Prop 45 would reduce these projects’ CEQA review period by 1,077 days, on average (i.e., 1,668 – 591), resulting in an average reduction across the entire EIR sample of 603 days (or 1.65 years).
Figure 22. Reduction in CEQA Review Period (Calendar Days) for Non-Residential EIRs Under Prop 45

Non-Residential Non-EIR Timeline Impacts
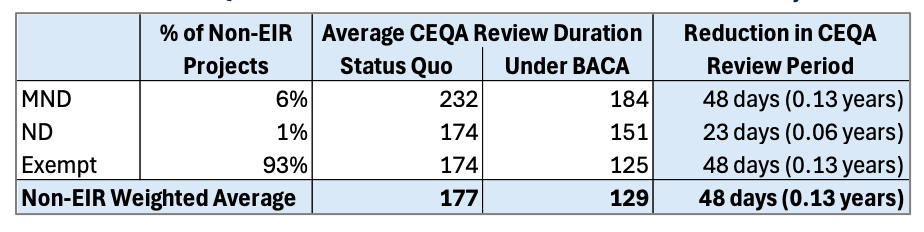
As shown in Figure 23, in the non-residential context, the average status quo MND project timeline is an estimated 232 days; for ND and Exempt projects, CEQA reviews are estimated to last 174 days, on average.41 Prop 45’s impact on these timelines is estimated by applying the applicable Prop 45 time limit (i.e., 322 days for MNDs and NDs; 191 days for Exempt) to modeled distributions of CEQA review timelines for each type.42
Based on this analysis, as shown in Figure 23, Prop 45 would reduce CEQA review periods by 48 days for MND and Exempt projects and by 23 days for ND projects. Given estimates of each non-EIR type’s share of total non-residential construction, the weighted average CEQA review period reduction across all non-EIR projects is 48 days.43
Figure 23. Reduction in CEQA Review Period for Non-EIR Non-Residential Projects Under Prop 45
Reduction in Non-Residential Project Costs
The total estimated reduction in project costs under Prop 45 is calculated by applying the estimated reduction in CEQA review duration to the estimated total cost of review period delay (an annual percentage).44 As summarized in Figure 24, for public agency sponsors, Prop 45 would reduce EIR project costs between 2.22% and 3.22%, on average, depending on the essential project category.45 Because project delays impose higher costs (per year) on IOUs and other private firms, Prop 45 would reduce EIR project costs for these sponsors between 2.81% and 8.17%. The measure would reduce non-EIR costs by 0.18% to 0.26% for public agencies and by 0.22% to 0.65% for IOUs and private firms.46
Figure 24. Estimated Reduction in Non-Residential Project Costs Under Prop 45

Non-Residential Construction: Economic and Fiscal Impacts
The annual dollar value of Prop 45’s savings is determined based on estimates of the total amount spent annually on EIR and non-EIR project construction in each essential project category multiplied by the percent reduction in costs.
Construction Spending by CEQA Type, Sponsor Type, and Essential Category
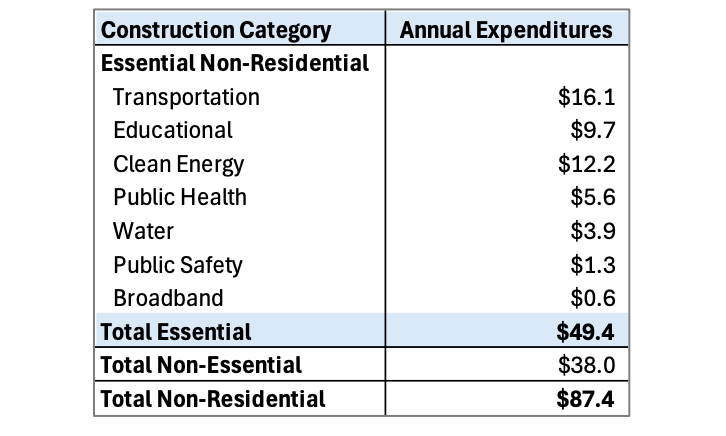
During Calendar Year 2024, an estimated $87.4 billion was spent on the construction of new non-residential buildings and infrastructure in California.47 Of this spending, Prop 45’s essential project categories accounted for an estimated $49.4 billion.48 As shown in Figure 25, over half of essential project spending is attributable to transportation and clean energy investments ($28.3 billion).
Figure 25. Annual Construction Spending in California, by Non-Residential Category (bil 2025 $)
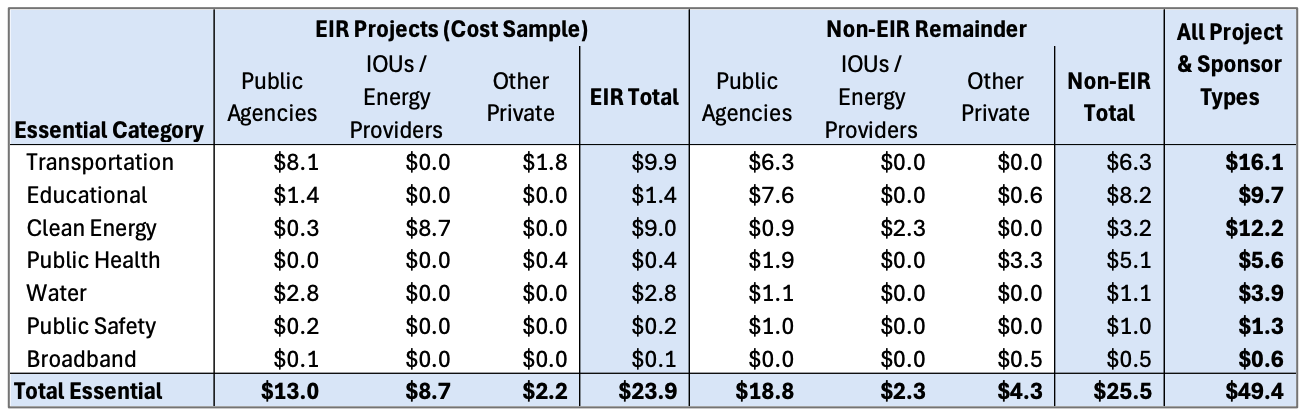
Because cost savings depend on the project’s sponsor, CEQA timeline, and essential category, the total annual savings under Prop 45 depends on the share of annual expenditures attributable to each CEQA project type (i.e., EIRs vs. non-EIR) and sponsor type (i.e., public agencies, IOUs and clean energy developers, and other private firms).49 As shown in Figure 26, EIRs account for an estimated $23.9 billion in annual spending; public agency spending accounts for $13 billion (or 54%) of this total.50 Across all sponsor types, EIR transportation projects ($9.9 billion) and EIR clean energy projects ($9.0 billion) account for nearly $20 billion, or 79% of total EIR spending.51
Figure 26. Estimated Annual Spending by CEQA Type, Essential Category, and Sponsor Type (bil 2025 $)
Annual Savings by Project Sponsor Type
Prop 45 Would Save Public Agencies $386 Million Annually on Essential Project Construction
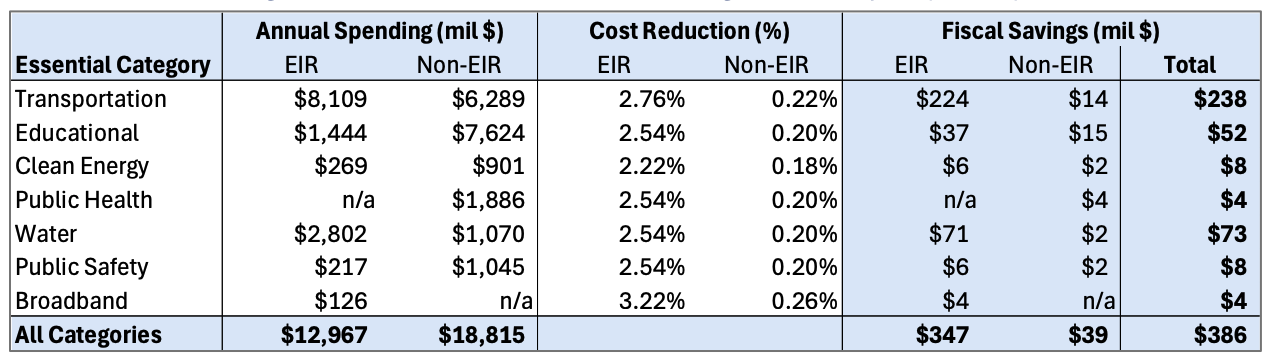
As shown in Figure 27, across all essential project categories and CEQA project types, Prop 45 would generate $386 million annually in savings for public agencies.52 Transportation projects account for roughly 62% of this total ($238 million), while water and educational facility construction costs are estimated to decline by $73 million and $52 million, respectively.
Figure 27. Estimated Annual Fiscal Savings Under Prop 45 (2025 $)
Lower Clean Energy Project Costs Would Generate an Estimated $250 Million in Annual Ratepayer Savings
By reducing clean energy project costs, Prop 45 is estimated to save California ratepayers $250 million annually. Because both IOUs and public utilities recoup the costs of transmission system upgrades and energy procurement through the electricity rates, clean energy project savings generally accrue to ratepayers rather than to utilities or clean energy developers.53 Figure 28 summarizes the estimated annual ratepayer savings across CEQA project types.
Figure 28. Estimated Annual Ratepayer Savings Under Prop 45 (2025 $)

Annual Construction Costs Incurred by Other Project Developers Would Decline by $137 Million
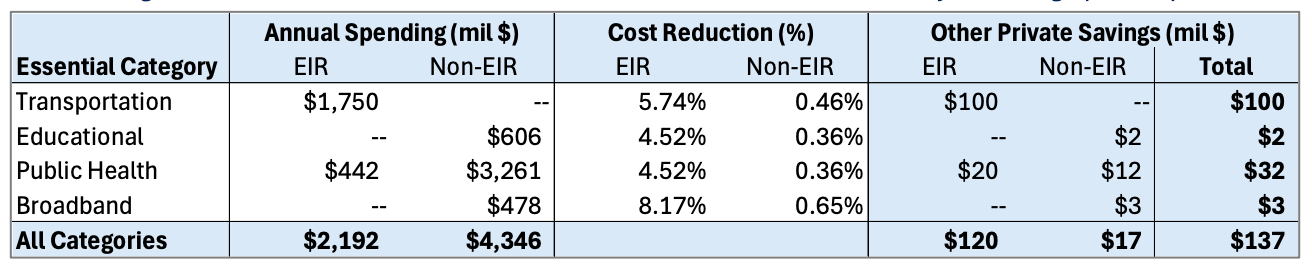
In addition to these fiscal savings and ratepayer benefits, Prop 45 would also generate savings for private sector developers of essential transportation, educational, public health, and broadband projects. As shown in Figure 29, these sponsors would save an estimated $137 million annually under Prop 45.
Figure 29. Additional Annual Economic Benefits from Other Private Project Savings (2025 $)
Prop 45 Would Reduce Total Non-Residential Project Costs by $774 Million Annually
As shown in Figure 30, across all three types of economic and fiscal impacts estimated above, Prop 45 would generate an estimated $774 million annually in savings for Californians and state and local governments.
Figure 30. Summary of Fiscal and Economic Savings from Non-Residential Construction (mil 2025 $)

V. Conclusion
Prop 45 is expected to generate substantial economic and fiscal benefits for Californians, state and local governments, and other public agencies. The measure’s impact on residential project review timelines is estimated to increase housing production by nearly 20,000 units per year statewide and nearly 200,000 over a decade. Additionally, residential construction activity would generate an estimated $315 million of PIT, corporation tax, and sales tax revenue annually for the state General Fund. Including the property tax revenues generated by the completion of new residential units under Prop 45, local governments would collect $786 million annually, on average, over the 10-year period following the measure’s implementation.
In addition to these residential construction impacts, Prop 45’s timeline reductions would save public agencies $386 million in essential project construction costs. The decline in clean energy project costs would save California ratepayers an estimated $250 million annually; the costs incurred by other private sector essential project developers would decline by $137 million.
These savings estimates reflect conservative lower-bound estimates because they are derived only from the expected impacts of Prop 45’s CEQA review timeline provisions. Total economic and fiscal benefits realized under Prop 45 would include the impacts of expected reductions in other discretionary review periods and judicial review, as well as any timeline savings generated by the measure’s procedural reforms.
VI. Technical Appendix
CEQA Review Durations for EIR Project Samples
This Appendix outlines the process used to identify the EIR projects included in the residential and non-residential EIR project samples.
For EIR projects that require CEQANet data submissions,54 lead agencies file a “Notice of Preparation” (NOP) on CEQANet when they determine that the project requires an EIR and file a “Notice of Determination” (NOD) when its EIR is certified. For this analysis, each project’s CEQA Review duration was estimated based on the number of calendar days between the latest posted NOP filing date and the earliest date that a lead agency NOD was issued.55 To minimize the impact of outliers on the estimation of status quo review durations, the EIR Project Sample excludes all projects with CEQA Review durations longer than fifteen years. Including these projects in the sample would increase reported average review timelines, and the corresponding impact of Prop 45 on reducing project timelines and costs.
Preliminary Identification of EIR Projects
The initial universe of EIR projects included all unique State Clearinghouse (SCH) Case Numbers (i.e., project IDs) that posted lead agency NODs to CEQANet between January 1, 2020 and April 1, 2026 that could be linked to at least one previously filed NOP. For the residential EIR sample, the determination of whether an EIR project was a residential project for purposes of Prop 45 was based on the project’s “NOC Development Type” field. In total, 620 EIR project Case Numbers fit these criteria. For the non-residential EIR sample, all projects assigned to the “Water Facilities,” “Transportation,” “Power,” or “Educational” development types were included in the analysis sample. In total, 348 unique EIR project Case Numbers fit these criteria.
Calculation of CEQA Review Timeline
For all projects in these preliminary samples, the CEQA Review period was estimated based on the number of calendar days between the latest NOP filing (for project IDs with more than one associated NOP) and the earliest lead agency NOD filing (for projects with more than one associated NOD). For two reasons, this approach to calculating a project’s CEQA Review duration results in a more conservative estimate of Prop 45’s impact on review timelines.
First, under Prop 45, the CEQA review period begins on the date that the application is deemed complete, and not the date that the NOP is filed. Because the application completeness date necessarily precedes the NOP date, some projects that have measured NOP-to-NOD durations less than 591 days would nevertheless have CEQA Review durations exceeding Prop 45’s 591-day threshold. That is, following an agency’s determination that a project application is complete, the lead agency then determines whether an EIR is necessary. As a result, the date that the NOP is issued necessarily comes after the application completeness date.56
Because this approach results in the shortest possible estimate of a project’s status quo CEQA Review duration (compared to, e.g., the earliest NOP to latest NOD timeline), it leads to the smallest possible estimate of Prop 45’s impact on the CEQA Review timeline. To the extent actual status quo CEQA review times are longer than the estimates presented in this report, the average reduction in EIR review periods under Prop 45 would be greater.
Limiting the Final EIR Project Sample
From this initial project sample, EIR projects were excluded based on the following:
- Projects with CEQA Review periods greater than 15 years. Projects with NOP-to-NOD timelines that exceeded 15 years were excluded from the project sample. These excluded projects would be subject to Prop 45 but have been excluded to reduce the impact of “outliers” on the estimated status quo CEQA review times.
- Projects related to General Plan or Housing Element approvals. For the residential EIR sample, project description fields for all projects with CEQA Review durations over eight years were reviewed to determine whether the project referenced a local government’s General Plan or Housing Element approval. Since these EIR projects do not involve a specific development proposal, they were removed from the final EIR sample.
Together, these two exclusion criteria removed 81 projects from the preliminary residential EIR sample of 620 projects, resulting in a final sample of 539 residential EIRs. For the non-residential EIR sample, 21 projects in the preliminary sample had NOP-NOD timelines over 15 years; after excluding these projects, 327 non-residential projects remained in the final non-residential EIR sample.
Fiscal Impact Methodology for Residential Construction
Estimates of the state and local tax revenues generated during the residential construction period were developed based on the publicly available economic data, state and local tax rates in effect as of FY 2024 – 2025, and IMPLAN model data on the number of wage and salary jobs supported by a given level of development activity (excluding any “multiplier” economic impacts).
Personal Income Tax
Construction period development activity generates PIT revenue from three payer types: employees paid wages or salary by construction firms; the proprietors of these firms; and the partners of impacted S-Corps, who pay PIT on their corporation’s pass-through income.
PIT from Employees
Estimated PIT revenue from wage and salary employees was derived from IMPLAN’s reported estimates of the number of wage and salary jobs supported by direct construction activity. IMPLAN’s aggregation of data collected by the federal Bureau of Economic Analysis (BEA) shows the distribution of occupation types (e.g., executives, administrative assistants, construction laborers) for each industry (e.g., construction, professional services, manufacturing) in California along with the average annual compensation paid to that occupation in each industry. PIT revenues for workers in each occupation were based on FTB data showing the average effective PIT rate imposed on PIT payers across various Adjusted Gross Income (AGI) buckets over the 2014 – 2020 period (e.g., Californians earning $60,000 – $80,000 faced a 2.7% average rate).57
PIT from Proprietor Employment
IMPLAN also estimates the share of total construction sector expenditures that is earned as income by proprietors of construction firms. The estimated effective PIT rate paid on this income was based on annual business income data from the FTB.58 Specifically, the weighted average effective tax rate for business income was calculated across all AGI buckets from 2014 through 2020, with weights applied to the rate for each AGI bucket based on the total amount of net business income for that AGI bucket. This methodology resulted in an overall effective tax rate of 4.26% on net business income.
Pass-Through Income from S-Corps
Estimation of the PIT revenue associated with S-Corps’ pass-through income was based on the same detailed annual FTB data described above. The weighted average effective PIT rate paid on pass-through income and partnership profits was 9.32% for the period from 2014 through 2020. This rate was applied to 98.5% of the estimated S-Corp share of corporate profits reported by IMPLAN (i.e., total S-Corp profits less the 1.5% paid as corporate income tax).
Corporation Tax
Estimates of corporation tax revenues were based on IMPLAN estimates of the corporate profits generated by construction firms. Total corporate profits were allocated to S-Corps and C-Corps in proportion to the share of total construction sector business receipts collected by each corporation type as of 2015, based on data published by the IRS’s Statistics of Income (SOI) program.
The state corporate income tax revenues generated by these profits is based on data published by the State of California Franchise Tax Board (FTB). S-Corps pay a 1.5% rate on in-state profits (with the remaining 98.5% treated as pass-through income subject to the personal income tax), while an analysis of FTB data shows that C-Corps paid an average effective corporate income tax rate of 2.4% on their in-state profits over the 2013 – 2022 period (lower than the 8.84% statutory rate due to various deductions and tax credits and the ability to carry over net losses from prior years).59
Sales Tax: State General Fund and Local Shares
Sales tax revenue estimates were derived by multiplying the applicable sales tax rate by the estimated total taxable sales generated by the estimated annual development cost. The increase in taxable sales attributable to this total estimated development cost was based on the total value of intermediate inputs purchased by construction firms from their suppliers, as estimated by IMPLAN. For non-taxable inputs (e.g., services), the estimated purchase amount was excluded from the sales tax base estimate.
State General Fund sales tax revenues were calculated by multiplying the estimated increase in taxable sales by the General Fund’s base sales tax rate (i.e., 3.9375%). Local sales tax revenues are based on a combined local rate of 4.97%, which includes the Bradley-Burns rate (1.25%), the Public Safety Fund rate (0.50%), and the 1991 and 2011 Realignment shares (1.5625% combined), and the weighted average district tax rate across all local governments in California (1.66%).60
EIR Cost Sample
The Non-Residential EIR Cost Sample includes all non-residential EIR projects in essential project categories that circulated a draft EIR between January 1, 2025, and December 31, 2025. Across all project construction types (i.e., including non-essential categories and residential construction), 281 EIRs were circulated during this period. Residential projects as well as non-essential non-residential projects (223 projects total) were then removed from the sample based on review of each EIR project’s “development type” data field on CEQANet. Of the remaining 58 projects in essential project categories, 10 projects relating to master plan updates or programmatic EIRs (PEIRs) were removed from the sample (since these project types do not involve specific development proposals for which costs can be estimated). As a result, the final analysis sample included 48 essential projects.
For each of the projects in the Cost Sample, total development costs were determined based on public project filing data, news reports or descriptions of the development (e.g., square footage, megawatts of solar capacity installed) and typical per-unit construction costs (e.g., dollars per square foot, dollars per megawatt) published in public surveys or other studies. To ensure that the expected costs of proposed megaprojects would not result in overestimates of the EIR project share of total non-residential project spending, the reported costs for these projects were reduced by 75%.61
Summary of Prop 45’s Non-Timeline Procedural Reforms
In addition to establishing enforceable timelines, Prop 45 introduces other reforms intended to reduce delays associated with the preparation of EIRs and associated litigation that could further reduce review period timelines and reduce review costs for local governments. These reforms target well-documented sources of review-related costs imposed on project developers.
Streamlined Alternatives Analysis
Prop 45 would allow EIR project sponsors to elect to use a streamlined “alternatives analysis” during CEQA review, which would limit the range of alternative projects analyzed in an EIR.62 By constraining the number of different projects analyzed, this option may reduce the costs of generating alternative designs, conducting technical studies, drafting the EIR, and responding to public comments.
Exclusion of late comments
Prop 45 would require that public comments be filed at least 72 hours prior to a proposed project’s public hearing related to its CEQA approval; late-submitted comments would be excluded from the administrative record.63 Currently, project opponents may submit comments to lead agencies following the conclusion of the formal public review period, in some cases just hours prior to a public hearing on the project’s approval. These late comments impose added costs on lead agencies and project sponsors by requiring additional analyses and responses and may delay hearings to afford the lead agency sufficient time to respond.64
Limits on the scope of legal challenges
Prop 45 would limit any CEQA-related litigation to allegations that a project’s approval conflicted with “objective, quantifiable, and written standards” that were in effect when the project’s application was submitted. This provision would reduce the number of CEQA-related legal challenges brought against projects sponsored by local agencies and could further reduce the expense of CEQA review itself.65
- Detail on the measure’s procedural reforms is provided in the Technical Appendix.
- For essential projects that are exempt from CEQA, the agency must complete the documentation supporting this determination within 90 business days (or roughly 131 calendar days) of application completeness. For projects that are determined to have a “less than significant impact,” a negative declaration (ND) or mitigated negative declaration (MND) must be adopted within 180 business days (262 calendar days). Prop 45’s impact on the average timelines for these other project types depends on how frequently these projects’ CEQA reviews exceed Prop 45’s time limits.
- Edward L. Glaeser and Joseph Gyourko, “The Impact of Building Restrictions on Housing Affordability,” Economic Policy Review, 9(2), 21–39 (2003); Michael Manville, et al., “Does Discretion Delay Development? The Impact of Approval Pathways on Multifamily Housing’s Time to Permit,” Journal of the American Planning Association, 89(3), 336–347 (2022); Carolina Reid and Hayley Raetz, “Perspectives: Practitioners weigh in on drivers of rising housing construction costs in San Francisco,” UC Berkeley Terner Center for Housing Innovation (2018).
- Alexander Casey, et al., “Modeling New Housing Supply in Los Angeles,” Terner Center for Housing Innovation (October 2022).
- The entitlement time elasticity is calculated by dividing the predicted increase in residential permitting (in this case, 9.8%) by the reduction in entitlement durations (25%). Terner’s entitlement reform package (i.e., policy prescription D, “Streamline the process”) includes other elements in addition to the entitlement timeline reduction (see Terner Center, page 5). Specifically, the prescription also reduces “assumed entitlement costs” and “entitlement density compromises” (i.e., the difference between the number of units ultimately entitled and the number of units proposed by the project sponsor) by 25%. While this report’s estimate of Prop 45’s impact on housing production only directly considers the expected change in entitlement timelines, Terner’s elasticity estimate is nevertheless an appropriate basis for developing this estimate since Prop 45’s provisions would also likely impact entitlement costs and density concessions. Prop 45 introduces several “non-timeline” provisions that would reduce public agency entitlement costs that are ultimately imposed as fees on developers. For example, under Prop 45, public comments must be filed at least 72 hours prior to a public hearing on a project’s CEQA review, and late-submitted comments are excluded from the administrative record (see Prop 45, Section 21021). Additionally, Prop 45 would allow proponents to elect to use a streamlined “alternatives analysis” during CEQA review, which would limit the range of alternative projects analyzed in an EIR. Moreover, Terner’s elasticity estimate is based on status quo entitlement timelines ranging from just six months (for 2-4 unit buildings) to 18 months (for buildings with 50+ units). However, actual entitlement timelines typically exceed these durations, as shown in the following section of this report, and as is noted by Gabriel and Kung (see Note 6). As a share of total development costs, carrying costs increase as entitlement timelines increase; therefore, the impact on development feasibility of a 25% reduction in this timeline increases as the status quo entitlement duration increases.
- Stuart Gabriel and Edward Kung, “Development Approval Timelines, Approval Uncertainty, and New Housing Supply: Evidence from Los Angeles” (June 24, 2024). A revised version of this study was published in February 2025.
- The standard deviation of a distribution measures how widely dispersed individual values are around the distribution’s mean. Wider distributions, in which individual values tend to fall farther from the mean, have higher standard deviations. Gabriel and Kung compute this measure on the natural log of each project’s approval time rather than on the approval time itself. Therefore, this report’s estimates of the change in review period standard deviations under Prop 45 do not directly translate to reductions in entitlement volatility. See the Technical Appendix for further detail on this modeling.
- Because entitlement time excludes the time spent by public agencies reviewing an application’s submission prior to the determination of application completeness, this analysis does not capture the potential impact of Prop 45’s 30-day limit on this initial review on project feasibility. “Entitlement time” is defined as the number of calendar days between the date that an application is deemed complete and the date that the project is fully entitled.
- While judicial review periods under current law can impose significant delays on project entitlement, CEQANet data does not show the typical duration of these proceedings, and prior research has shown that only a small share of residential projects are subject to legal challenges. This analysis conservatively shows the impact of Prop 45 excluding the judicial review period from the estimate of total status quo entitlement time. To the extent some of these projects would be subject to litigation that would have been shortened by Prop 45, the measure’s impact on housing production would be even larger than this report’s estimate. Similarly, because lead agencies only file CEQA-related documents on CEQANet, it is not possible to calculate a status quo Other Entitlement timeline for residential projects. For this analysis, it is conservatively assumed that this post-certification phase of the entitlement period lasts 135 days, the maximum allowed under Prop 45, for all projects. Under this modeling assumption, Prop 45’s 135-day time limit has no impact on the time spent in Other Entitlement. It is further conservatively assumed that the judicial review and Other Entitlement phases contribute no additional volatility to total entitlement times; the estimated volatility of total entitlement time for each project type therefore reflects only the volatility of the CEQA Review phase.
- See the Technical Appendix for detail on the selection of EIR projects for the EIR Project Sample.
- Prop 45 effectively imposes a 531 calendar day (365 business day) limit on EIR preparation, though lead agencies that are unable to meet this deadline are afforded an additional 60 calendar days to schedule a public hearing and make a determination. Therefore, for this analysis, the maximum EIR timeline is set at 591 days.
- Because the Other Entitlement period is conservatively assumed to be of fixed duration for all projects, it contributes no additional variation to total entitlement times. To calculate the volatility measure, each project’s CEQA review period in the EIR sample was converted to its natural logarithm under both the status quo and Prop 45. For a project with a status quo review period of 750 days, for example, the logged status quo duration is ln(750), or 6.62; because this project exceeds Prop 45’s 591-day limit, its duration under Prop 45 is capped at 591 days, and its logged duration falls to ln(591), or 6.38. Projects already completing review within the limit are unaffected. The volatility measure is the standard deviation of logged review periods across the sample.
- AEP (2019). Because CEQANet does not report the date that CEQA reviews of non-EIR projects were initiated, this data source cannot be used to estimate average CEQA review durations for these project types.
- Because AEP reports only the average CEQA review duration across all projects of each type, it is not possible to calculate the variation in these timelines across projects in order to determine the portion of non-EIR projects with review periods exceeding the Prop 45 time limit. Given the long tail of CEQA review periods above the project mean (as shown for the status quo EIR review periods in Figure 6), the distributions of non-EIR status quo review period durations were modeled as right-skewed lognormal distributions, in which most projects cluster near the median while a small share take substantially longer. (The modeled lognormal fit was validated against the EIR project sample, where the observed standard deviation of log review durations (0.847) closely matches the value implied by fitting a lognormal distribution to the sample mean and standard deviation (0.838).) For each non-EIR project type, the distribution’s mean was set equal to the AEP-reported mean review duration. The distribution’s standard deviation was estimated by applying the coefficient of variation for the EIR project sample under the status quo, i.e., the EIR sample’s standard deviation (1,151 days) divided by its mean (1,141 days), or approximately 1.01. As a result, for MND projects, the distribution’s status quo mean is eight months (or 240 days) and the standard deviation is 242 days (i.e., 1.01 × 240). Estimations of these reductions were calculated by simulating project samples for each non-EIR project type based on the mean and standard deviation parameters detailed above. As for EIR projects, post-Prop 45 average review durations and volatility measures for each non-EIR project type were calculated by applying Prop 45’s time limits to simulated projects with status quo review periods exceeding these limits.
- As with EIR projects, it is conservatively assumed that Prop 45 would not affect the average duration of the non-EIR entitlement reviews outside the CEQA process.
- See Note 12 for detail on the calculation of the volatility measure.
- According to data published by the state Department of Finance (DOF), 108,269 residential units were permitted annually in California over the 2021 – 2025 period (see DOF (2025)). Estimation of each CEQA project type’s share of total permitting is based on AEP survey results (see the “Percent of Units” column in Figure 12). Though the AEP’s survey findings relate to the permitting of 5+ unit multifamily buildings, there is no publicly available data that reports CEQA project type permitting shares across all types of residential construction (i.e., including single-family homes and smaller multifamily buildings). AEP-based estimates of these shares may therefore overstate or understate a CEQA project type’s actual share. However, it is unlikely that a CEQA review type’s share of 5+ unit permitting differs substantially from its permitting share across all units. For example, given that many new single-family homes are developed as part of large subdivisions, it is likely that EIR projects also account for a significant share of single-family unit permits.
- DOF (2026). Under baseline trends, the housing stock would reach approximately 16,147,000 units by 2036. The marginal increase in permitting under Prop 45 (19,577 units annually) would add 195,769 units after 10 years, increasing the total housing stock to 16,343,000 units, or roughly a 1.21% increase relative to the baseline estimate.
- Seva Rodnyansky, Dennis Su, and Alex Horowitz, “New Housing Slows Rent Growth Most for Older, More Affordable Units,” Pew Research Center, July 31, 2025. Supply-price effect estimates vary widely across studies due to several modeling choices, such as the study’s geographic scope (e.g., local versus national) and the timescale (i.e., short-run vs long-run price adjustments). Studies that measure price effects within individual neighborhoods generally find smaller effects per unit of new supply than studies conducted at the metropolitan or national scale, because households can readily substitute between nearby neighborhoods but cannot as easily substitute between regions. For an example of local impact estimates, see Andreas Mense, “The Impact of New Housing Supply on the Distribution of Rents,” Journal of Political Economy Macroeconomics (January 27, 2025); Mense estimates that neighborhood rents decline by 0.19% for every 1% increase in supply (i.e., a supply-price effect of 0.19). By contrast, Albouy et al.’s (2016) survey of nationwide home price and housing consumption data predicts a price decline of 1.54% for every 1% increase in supply (i.e., a supply-price effect of 1.54). David Albouy, Gabriel Ehrlich, Yingyi Liu, “Housing Demand, Cost-Of-Living Inequality, And The Affordability Crisis,” NBER Working Paper 22816 (2016). Based on the research surveyed for this report, Pew’s estimated supply-price effect of 0.54 falls in the middle of the range of these empirical estimates.
- Chang-Tai Hsieh and Enrico Moretti, “Housing Constraints and Spatial Misallocation,” American Economic Journal: Macroeconomics (2019).
- Legislative Analyst’s Office (LAO), “California’s High Housing Costs: Causes and Consequences,” March 17, 2015.
- Per-unit development costs are calculated by subtracting land acquisition costs from the average total sales value of single-family homes and condos. An analysis published by the National Association of Home Builders (NAHB) shows that in the Pacific region (i.e., California, Oregon, and Washington), land acquisition accounts for 24% of the typical new single-family home sales price. NAHB, “Lot Values Trend Higher in 2024,” July 14, 2025. For multifamily units, land accounts for an estimated 16% of the total value. See Jason M. Warde and Luke Schlake, “The High Cost of Producing Multifamily Housing in California,” RAND Corporation (2025). It is assumed for this report that the new housing made feasible by Prop 45 would be distributed between single-family and multifamily construction in proportion to each unit type’s share of current housing production statewide (i.e., 55% single-family and 45% multifamily). As a result, given Zillow-based estimates of the average total sales prices for single-family homes and condos shown in Figure 13, the weighted average per-unit development cost is an estimated $573,800. Depending on the region and the type of development, the sales price of a new-construction home typically exceeds the price of the average existing home. Because California’s lower-cost regions account for a disproportionate share of new home construction, however, for this analysis it is assumed that the new-construction and existing home values are equal.
- Given an estimate of new construction spending in California, IMPLAN data is used to estimate total expenditures allocated to labor, purchases of supplies, corporate profits, and other categories. The estimated increase in each tax base excludes any economic “multiplier” impacts generated by this new construction activity. The Technical Appendix provides a detailed overview of this analysis.
- In California, under Proposition 13, a new or transferred unit’s assessed value is equal to its sales price; increases in assessed value are thereafter limited to a maximum rate of 2% annually. As a result, recently transferred units (including all new units) pay higher effective property tax rates than existing units. Because the annual rate of home price appreciation in California has far exceeded the 2% maximum rate since Proposition 13 was enacted, existing homes’ assessed values are, on average, roughly 34% lower than their market values. The ratio of total residential market value to assessed value is based on analysis of property tax revenue relative to total market value at the county-level published by ATTOM. See ATTOM, “Average Single-Family Home Property Tax Bill Rose 3 Percent in 2025,” April 9, 2026. To estimate statewide assessed value from this ATTOM data, ATTOM’s estimates of property tax revenue were divided by the average total county property tax rate in effect as of 2025. See California State Board of Equalization (BOE), “2024-25 Annual Report,” April 2026.
- For this analysis it is assumed that undeveloped parcel assessed values for each unit type are equal to the residual land values calculated in Figure 13. To estimate the measure’s impact on property tax revenues, the cumulative number of additional units built as of each year following Prop 45’s implementation is multiplied by the increase in assessed value per unit, i.e., the unit’s sales price less the assessed value of the pre-existing vacant or under-developed parcel.
- Though Prop 45 would reduce average market values for existing units (as summarized in “Prop 45’s Impact on Housing Affordability”), this impact remains modest over the initial 10-year period. For the first year following implementation, the measure would only reduce prices by 0.066% (i.e., 10% of the estimated Year 10 price impact), and only the existing units that are sold during that year would be assessed at their market value rather than their capped value under Proposition 13. Additionally, this report’s estimates of the total assessed value added to the roll under Prop 45 are conservatively based on the estimated average value as of Year 10 (i.e., $718,600), when Prop 45’s impact on prices is most significant.
- Most clean energy projects in the interconnection queue, for example, never provide power. Analysis of interconnection queue data across the seven U.S. independent system operators and forty-five utilities finds that only 13% of the generation capacity that requested interconnection between 2000 and 2020 had reached commercial operation by the end of 2025; 75% of requested capacity was withdrawn, and the remaining 10% was still active. See Lawrence Berkeley National Laboratory and GridTracker, “Queued Up: 2026 Edition: Characteristics of Power Plants Seeking Transmission Interconnection” (2026).
- See Figure 26. In total, across all CEQA project types, an estimated $11.1 billion is spent by IOUs/Energy Providers in the clean energy category. Across all categories, these sponsors and other private firms combine to spend $17.6 billion annually.
- Maria Surina, “Powering the Future: Infrastructure Trends, Performance, and Portfolio Impact,” Cambridge Associates, July 25, 2025. This analysis finds that the median nominal net internal rate of return (IRR) is 14.1% for renewables funds. Because this rate of return is calculated net of managers’ fees and shares of profits, the median gross rate of return earned on capital deployed to solar projects is an estimated 18% nominal, or approximately 16% in real terms. To the extent the investor portfolios surveyed in this analysis include investments in power projects that had already completed engineering and design or permitting, this study’s estimated IRR would understate the actual IRR demanded by investors on pre-development capital commitments.
- Annual discount rates vary across contexts; the federal government, for example, applies a real discount rate of three to seven percent annually. Qingran Li and William Pizer, “Discounting for Public Benefit-Cost Analysis,” Resources for the Future, July 6, 2021.
- Caltrans, “Understanding Cal-B/C Assumptions and Parameters (Module 5),” accessed August 27, 2026.
- For transportation projects, for example, Caltrans reports that costs related to engineering, design, and project review account for 15% of total project costs (see California Transportation Commission, Project Delivery Workshop, 2020). Broadband projects incur the highest share of costs (25%) prior to construction (see Fiber Broadband Association, “Fiber Deployment Cost Annual Report,” 2025). Clean energy pre-development costs are conservatively estimated to account for three percent of the total based on United States Department of Energy (DOE) modeling showing that, on average, nationwide solar plant costs are $1,726 per kilowatt installed, of which roughly $51 is related to the Engineering, Permits, Interconnect, and Outreach cost categories (DOE, “PV System Cost Model,” 2024). Because the permitting process in California is more complex than in other states, the pre-construction cost share in California is likely higher. For all other essential project categories, the pre-development cost share is an estimated 10%, based on the Federal Emergency Management Agency’s (FEMA) cost estimating tool (FEMA, “Public Assistance Cost Estimating Tool for Engineering and Design Services,” December 18, 2015). FEMA estimates that engineering and design services (EDS) account for 16% of project costs for projects of above-average complexity that cost roughly $1 million; the EDS share falls to 6% for projects costing $100 million. Because the tool excludes “special project costs” such as environmental surveys or other feasibility studies, these percentage estimates may understate typical pre-development cost shares of Prop 45’s other essential project categories.
- Helen Kerstein, “New Infrastructure Legislation: Summary and Issues for Legislative Oversight,” Legislative Analyst’s Office (LAO), August 8, 2023; California Assembly Select Committee on Permitting Reform, Final Report, March 2025; Samuel Trachtman, “To Make California More Affordable, Government Must Foster Sustainable Growth,” Berkeley Economy & Society Initiative, May 2026.
- Construction cost inflation is based on California Department of General Services (DGS), “California Construction Cost Index (CCCI),” accessed May 11, 2026. Overall inflation is based on California Department of Finance (DOF), “Economic Forecasts, U.S., California, and Counties” (November 2025 forecast), accessed May 1, 2025.
- The real cumulative increase in California construction costs is calculated as [(1 + CCCI growth) / (1 + CPI growth) – 1], or [(1 + .672) / (1 + .414) – 1].
- Brian Potter, “Does Construction Ever Get Cheaper?,” Construction Physics, February 1, 2023. Potter compares construction cost inflation, as measured by the Turner Construction Nonresidential Index, to nationwide inflation over successive 10-year periods between 1920 and 2020. Over the 1970 – 1980 period, there was no difference between CPI inflation and Turner Index inflation. For every other decade after the 1920s, construction costs rose faster than CPI.
- Persistent real increases in construction costs are consistent with the “Baumol effect,” under which price inflation in sectors with lower rates of productivity growth, such as construction, exceeds price inflation across the broader economy. See, e.g., Omar Swei, “Long-Run Construction Cost Trends: Baumol’s Cost Disease and a Disaggregate Look at Building Material Price Dynamics,” Journal of Construction Engineering and Management, Volume 144, Issue 7 (May 9, 2018); Austan Goolsbee and Chad Syverson, “The Strange and Awful Path of Productivity in the U.S. Construction Sector,” Journal of Economic Perspectives, 2023.
- As shown in Figure 18, real construction cost growth over the 2020–2025 period substantially outpaced the rate of growth over the 2001–2020 period; between 2001 and 2005, construction cost inflation was roughly equivalent to all-items inflation. Using the longer historical period as the basis for estimating future construction cost growth rates therefore results in a more conservative estimate of Prop 45’s cost savings impact than would be obtained using more recent data.
- The real annual increase in California construction costs is calculated as [(1 + CCCI growth) / (1 + CPI growth) – 1], or [(1 + .041) / (1 + .028) – 1].
- See the Technical Appendix for detail on the selection of EIR samples.
- Because there is no public data that reports average CEQA review durations for non-EIR projects in the non-residential context, for non-EIR projects, the estimated status quo CEQA review durations shown in Figure 23 are calculated by applying the ratio of non-EIR to EIR CEQA review timelines in the residential context to the average non-residential EIR timeline (i.e., 1,101 days). For example, for residential MNDs, the status quo CEQA review period is an estimated 240 days, or roughly 21% of the status quo EIR project average duration (i.e., 1,141 days). Therefore, given the 1,101-day CEQA review period average for non-residential EIRs, the average non-residential MND’s CEQA review period is 232 days (i.e., 21% of 1,101).
- Detail on the modeling of non-EIR review period distributions is provided at Notes 14 and 28.
- Each non-EIR type’s percentage share is estimated based on its share of total non-EIR filings on CEQANet during Calendar Year 2025. During 2025, 16,134 non-EIR determinations were filed on CEQANet. Of these, 14,999 documents (or 93%) were Notices of Exemption (NOE), 985 were MNDs, and the remaining 150 were NDs.
- The per-year delay cost varies across essential project categories and sponsor types (see Figure 20), while Prop 45’s estimated impact on review period duration varies across CEQA types.
- For example, because clean energy project costs are estimated to decline by 1.34% for every one-year reduction in the review period (see Figure 20), the estimated 1.65-year reduction in EIR review timelines under Prop 45 would reduce public agencies’ clean energy EIR costs by 2.22% (i.e., 1.34% per year × 1.65 years).
- Full category-specific cost reduction estimates are shown for public agencies, IOUs, and other private firms in Figure 24.
- United States Census, “Construction Spending: Historical Value Put in Place” (2024), accessed May 1, 2026.
- Estimates of total spending in essential categories are based on Census data and data from the BEA’s “Benchmark Input-Output” model as aggregated by IMPLAN. See IMPLAN, “Special Industry Definitions” (June 27, 2017). From this BEA data, the IMPLAN model estimates spending across seven non-residential sub-sectors. For the essential health care, clean energy, transportation, and educational project categories, the annual spending estimates shown in Figure 25 were estimated by multiplying total CY 2024 non-residential project expenditures in California (i.e., $87.4 billion) by IMPLAN’s estimate of each category’s share of total non-residential spending. Because IMPLAN does not estimate spending on public safety, water, or communications infrastructure, estimates for these categories are based on Census survey data showing each category’s share of nationwide non-residential expenditures (see Note 47). For example, the Census estimates that public safety buildings comprised roughly 1.4% of total non-residential expenditures nationwide; in California, this category is therefore estimated to account for $1.26 billion in annual spending (i.e., 1.4% of $87.4 billion).
- EIR projects’ share of total spending in each essential category are based on publicly reported construction cost estimates for all essential non-residential EIRs circulated during calendar year 2025. See CEQANet filing data, January 2025 – January 2026 and the Technical Appendix for detail on the EIR Cost Sample.
- The state or local agencies included in the EIR Cost Sample include city or county governments or other public agencies, including transportation authorities, publicly owned utilities (POUs), school districts, and public universities.
- Total non-EIR project expenditures for each category are calculated by subtracting EIR expenditures from total expenditures and each sponsor type’s share of this non-EIR total is derived from Census survey data. For example, given total estimated transportation spending of $16.1 billion and the estimated EIR share of this total (i.e., $9.9 billion), non-EIR projects are estimated to account for the remaining $6.3 billion of annual transportation expenditures. According to the Census construction survey (see Note 47), state and local governments account for 28% of total nationwide construction spending on electric system infrastructure. Therefore, of the estimated $3.2 billion of spending on non-EIR clean energy projects, public agencies in California are allocated $0.9 billion (i.e., 28% of $3.2 billion) while IOUs and energy suppliers are allocated the remaining $2.3 billion. For all other essential categories, the non-public share of spending is assigned to other private businesses.
- Annual savings estimates are calculated by multiplying the total estimated EIR and non-EIR public agency expenditures in each essential project category by the applicable percentage cost reduction under Prop 45.
- Because utilities procure energy through a competitive bidding process, reductions in renewable energy development costs are passed on to the IOUs and public utilities procuring this energy. For IOUs, the electricity rates charged to consumers are authorized by the state based on the actual costs of providing service. Lower energy procurement costs therefore reduce IOUs’ authorized revenue requirement, resulting in lower rates.
- Prior to January 2022, lead agencies were only required to submit CEQA documents to CEQANet if the project involved state agency approvals or were determined to have “significant regional impacts.” It is therefore possible that CEQANet data for EIR projects certified prior to this date is not representative of all the EIR projects certified statewide. However, the Housing Workshop’s analysis of CEQA litigation rates estimates that over the 2013 – 2015 period, EIRs filed on CEQANet accounted for 66% of all EIRs certified statewide. The Housing Workshop, “CEQA by the Numbers” (May 2023).
- In some cases, lead agencies may post more than one NOP or NOD. Using the latest NOP and the earliest NOD results in the shortest (i.e. most conservative) estimate of the status quo review period.
- Though Prop 45 allows public agencies 30 days from the application completeness date to make this determination (see Section 21018(a)), this 30-day period runs concurrently with the 591-day EIR timeline.
- FTB, Table B-4A, California Open Data Portal. The period analyzed ended in 2020 to account for the changes made by AB 150, “California’s Passthrough Entity Elective Tax,” which went into effect in 2021. This elective credit is used as a workaround to the $10,000 federal cap on state and local tax (SALT) deductions, allowing passthrough entities to pay a flat 9.3% rate as corporation taxes (deductible against federal tax liability) and receive an offsetting credit against personal income tax liability for the partner or shareholder. This results in more tax payments reported as corporation tax payments rather than business income payments, even though there is no change in overall state taxes collected. Because this change is set to expire after 2025, this analysis assumes effective tax rates in the forecast period will reflect rates more similar to the period prior to 2021. For more detail, see What’s new for filing 2021 tax returns.
- FTB, Table B-4A, California Open Data Portal.
- FTB, Table C2-A and C2-B, California Open Data Portal (data.ca.gov/organization/california-franchise-tax-board). Average effective tax rates were calculated for each year over the 2013 – 2022 period by dividing the taxes paid to the state by C-Corps by the California share of their reported gross profits. The estimated effective rate of 2.4% reflects the average effective rate over this period.
- California Dept. of Tax and Fee Administration (CDTFA), “Effective Sales and Use Tax Rates” (cdtfa.ca.gov) and CDTFA, “Taxable Sales, by City” (cdtfa.ca.gov). The weighted average district tax rate was calculated by weighting the district tax rate of each city and unincorporated area in California by that community’s share of total taxable sales statewide as of FY 2024-2025.
- Megaprojects may be more likely to be withdrawn or significantly altered prior to project construction. The EIR Cost Sample includes two megaprojects: the Sepulveda Transit Corridor planned by LA Metro (estimated cost of $24.2 billion) and the Pure Water Southern California project (estimated cost of $7 billion).
- Prop 45, Section 21024 and 21025. The applicant’s proposed alternative must be compatible with the proposed project’s fundamental purpose and, to the extent practicable, with applicable local zoning and land use policies. The proposed alternative is not required to be located at a different site from the proposed project and may include alternative or additional onsite or offsite physical improvements or operational parameters designed to lessen impacts. See Prop 45, Section 21025(a).
- Prop 45, Section 21021.
- “CEQA: Targeted Reforms for California’s Core Environmental Law,” Little Hoover Commission (May 2024).
- In practice, due to the threat of litigation, lead agencies may prepare draft EIRs that anticipate potential objections to subjective project characteristics (e.g., by studying project alternatives or otherwise assessing the significance of a subjective impact). Similarly, following the EIR’s circulation, the lead agency must further respond to public comments based on these subjective concerns. By narrowing the focus of CEQA-related litigation to objective or quantifiable factors, Prop 45 would likely reduce the expenses that lead agencies incur anticipating or responding to these objections.
 Download Report